
A look at the ASP.NET Core logging provider for Azure App Service
08 Aug 2020Introduction
Last week, my colleague Stafford Williams was investigating an issue happening on a web application running on Azure App Service. Application Insights was taking longer than he was happy with to surface the log entries in the Azure portal, so he started using the Log stream feature of App Service. While log entries were appearing almost instantly there, by default they’re not filtered by category/namespace, so in addition to application logs, he was also getting framework-level logs, coming from MVC for example.
In this post we’ll talk about the ASP.NET Core logging provider for Azure App Service, and more specifically:
- What it does;
- How to enable it;
- How it works; and finally
- How to change its default behaviour.
What it does
The logging provider for Azure App Service integrates with the logging configuration and the Log stream feature of App Service. In a nutshell, it allows the log entries created by an ASP.NET Core application to be surfaced in Log stream.
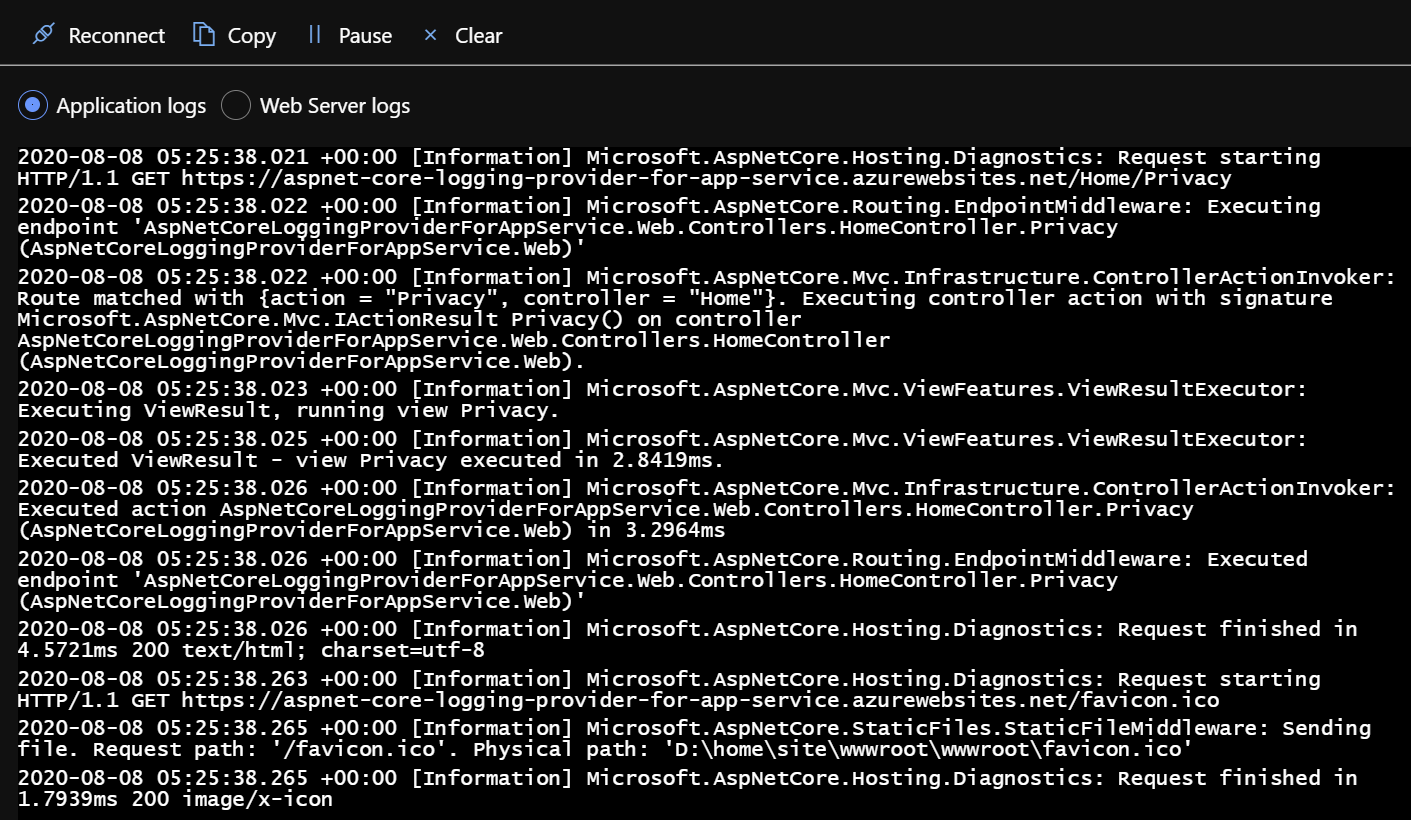 Application log entries surfaced in the Log stream blade of an App Service instance
Depending on the configuration applied in the App Service logs blade, the provider can write to the App Service file system and/or to a Storage Account, all while respecting the logging level configured for each of them!
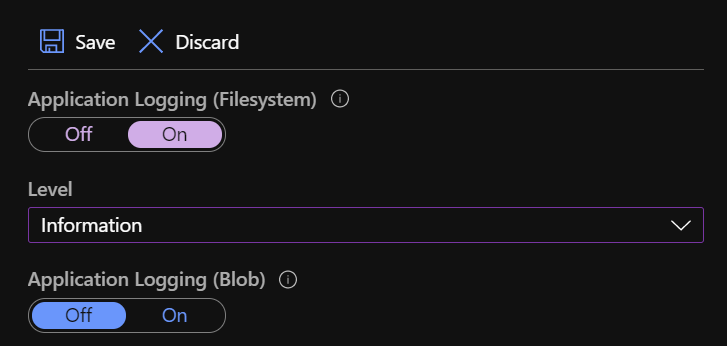 App Service logs blade showing file system and blob storage logging configuration
Because the Log stream integration is linked to the file system logging configuration, we’ll focus on this one for the rest of the blog post.
Next, let’s see how we can enable this capability in our ASP.NET Core application.
How to enable it
The first way to enable this capability is my personal favourite because it’s explicit; however, it requires code changes. We need to install the Microsoft.Extensions.Logging.AzureAppServices NuGet package and add the appropriate provider to the logging system. It really is that simple:
// Program.cs
+using Microsoft.Extensions.Logging;

public static IHostBuilder CreateHostBuilder(string[] args) =>
    Host.CreateDefaultBuilder(args)
+       .ConfigureLogging(builder => builder.AddAzureWebAppDiagnostics())
        .ConfigureWebHostDefaults(webBuilder =>
        {
            webBuilder.UseStartup<Startup>();
        });
The other option, if we’re in a situation where a code change is not possible for example, is to install the ASP.NET Core Logging Integration App Service extension, which we can do by navigating to the Extensions blade of our App Service. I also found that the Azure portal offers to install this extension when I went to the App Service logs blade. My guess is that the Stack property in Configuration > General settings must be set to .NET Core for that option to appear.
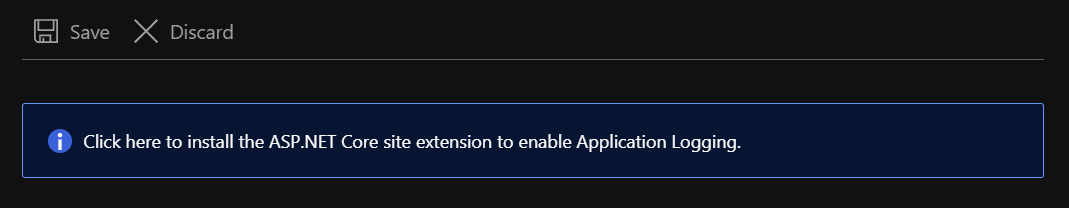 The banner we can click to install the ASP.NET Core Logging Integration extension
Let’s now focus on the way this provider works.
How it works
I learned lots of things while looking up the implementation of that provider, which as always is open-source on GitHub. This link — and the following ones in this post — specifically points to the release/3.1 branch instead of master because the latter has seen a lot of changes in preparation for .NET 5, the most notable being a lot of code moving from the dotnet/extensions repo to the dotnet/runtime one.
The first observation is that this provider is only enabled when the app runs on App Service, which is detected through a number of well-known environment variables defined in App Service. We’ll see later how we can take advantage of this to enable it when running the app locally.
The next interesting bit is discovering that the App Service file logger writes log entries to files in the %HOME%\LogFiles\Application directory, as seen in the code.
This explains why those entries show up in the Log stream feature of App Service, as the official documentation points out that:
[…] information written to files ending in .txt, .log, or .htm that are stored in the /LogFiles directory (d:/home/logfiles) is streamed by App Service.
Another finding is that the settings configured in the App Service logs blade are persisted in a JSON file on the App Service file system, more specifically in the %HOME%\site\diagnostics\settings.json file for a Windows App Service, which is loaded in a separate configuration object.
It’s worth noting that reload is enabled, indicating that logging settings can be updated and picked up by the app without requiring a restart, which is definitely a good thing.
Here’s what the structure of this file looks like:
{
    // File system settings
    "AzureDriveEnabled": true,
    "AzureDriveTraceLevel": "Information",

    // Blob storage settings
    "AzureBlobEnabled": false,
    "AzureBlobTraceLevel": "Error",

    // I suppose those are Table storage settings, but
    // neither the App Service logs blade nor the App Service logging provider
    // seem to set or use them
    "AzureTableEnabled": false,
    "AzureTableTraceLevel": "Error"
}
The AzureDriveEnabled property drives whether log entries are written to the file system, while the AzureDriveTraceLevel one controls the minimum level for the entries to be processed by the provider.
Let’s dig deeper on how log entries are filtered based on their level.
Segue into the ASP.NET Core logging system
The logging stack in ASP.NET Core has built-in support for filters, each of them optionally defining:
- Which logging provider it applies to;
- Which category or namespace it matches; and finally
- The minimum level for log entries to satisfy the filter.
The most common way to define filters is through the Logging section of the appsettings.json file, as documented and explained in the official documentation on docs.microsoft.com.
However, filters can also be defined in code, which is the method used by the App Service logger provider. After loading the logging configuration from the JSON file, a new filter is added to the global configuration with the following settings:
- It only applies to the
FileLoggerProvider, which is the one responsible to writing log entries to the file system; - No category or namespace is specified, meaning all log entries will be matched; and
- A minimum level is configured, based on the value of the
AzureDriveTraceLevelproperty.
See below an extract of the code, which may help put the pieces together:
public static class AzureAppServicesLoggerFactoryExtensions
{
    internal static ILoggingBuilder AddAzureWebAppDiagnostics(this ILoggingBuilder builder, IWebAppContext context)
    {
        [...]
        // This reads the `%HOME%\site\diagnostics\settings.json` JSON file mentioned earlier
        var config = SiteConfigurationProvider.GetAzureLoggingConfiguration(context);
        [...]
        services.AddSingleton<IConfigureOptions<LoggerFilterOptions>>(CreateFileFilterConfigureOptions(config));
        [...]
    }

    private static ConfigurationBasedLevelSwitcher CreateFileFilterConfigureOptions(IConfiguration config)
    {
        return new ConfigurationBasedLevelSwitcher(
            configuration: config,
            provider: typeof(FileLoggerProvider),
            levelKey: "AzureDriveTraceLevel");
    }
}

internal class ConfigurationBasedLevelSwitcher : IConfigureOptions<LoggerFilterOptions>
{
    private readonly IConfiguration _configuration;
    private readonly Type _provider;
    private readonly string _levelKey;

    public ConfigurationBasedLevelSwitcher(IConfiguration configuration, Type provider, string levelKey)
    {
        _configuration = configuration;
        _provider = provider;
        _levelKey = levelKey;
    }

    public void Configure(LoggerFilterOptions options)
    {
        options.Rules.Add(new LoggerFilterRule(_provider.FullName, null, GetLogLevel(), null));
    }

    private LogLevel GetLogLevel()
    {
        // Implementation omitted for brevity
        // Mapping between the log level defined in App Service JSON file (_levelKey) to a LogLevel value
    }
}
We now know that the App Service provider takes advantage of the built-in filtering capability of the logging system to limit which entries are written to the file system, making sure that the configured minimum log level is respected.
How the options system allows for a dynamic rule
We’ve established earlier in the post that changes to the logging configuration in App Service are picked up by the application without needing to restart the application. However, the code shown above doesn’t exhibit any dynamic capability: the filtering rule is added to the configuration once, with whatever minimum level is configured when that specific code is executed. How can the provider then dynamically adjust to logging configuration changes?
The answer lies in the fact that the options system in ASP.NET Core supports change notifications and reloadable configuration through the IOptionsMonitor<T> interface, as mentioned in the official documentation.
We can register change token sources that will be listened to by the default implementation OptionsMonitor<T>, and every time a change notification is fired, the specific options value will be created from scratch.
See this excerpt of code taken from GitHub:
public OptionsMonitor(
    // The service responsible for building the options values
    IOptionsFactory<TOptions> factory,

    // The sources of change tokens that are listened to
    IEnumerable<IOptionsChangeTokenSource<TOptions>> sources,

    // The service that caches options values until a change is detected
    IOptionsMonitorCache<TOptions> cache)
{
    _factory = factory;
    _sources = sources;
    _cache = cache;

    foreach (var source in _sources)
    {
        // 1. Subscribe to changes from all token sources, and invoke `InvokeChanged` whenever one notifies of a change.
        var registration = ChangeToken.OnChange(
            () => source.GetChangeToken(),
            (name) => InvokeChanged(name),
            source.Name);

        _registrations.Add(registration);
    }
}

private void InvokeChanged(string name)
{
    // 2. Remove the cached options value and call `Get` to build a new one.
    name = name ?? Options.DefaultName;
    _cache.TryRemove(name);
    var options = Get(name);

    // 4. Now that we've built a new instance, let subscribers know about it.
    if (_onChange != null)
    {
        _onChange.Invoke(options, name);
    }
}

public virtual TOptions Get(string name)
{
    // 3. When this is called from `InvokeChanged`, the cached value has just been removed,
    // so the options factory is used to build a new options value.
    name = name ?? Options.DefaultName;
    return _cache.GetOrAdd(name, () => _factory.Create(name));
}
Do you remember how we noticed earlier that the App Service logging provider loaded the %HOME%\site\diagnostics\settings.json file into a configuration object and changes to the file could be picked up by enabling the reload capability?
The options system provides an adapter for the configuration stack so that a change in configuration can also be interpreted as an options change notification, and the logging provider for App Service makes use of it:
public static class AzureAppServicesLoggerFactoryExtensions
{
    internal static ILoggingBuilder AddAzureWebAppDiagnostics(this ILoggingBuilder builder, IWebAppContext context)
    {
        [...]
        // This reads the `%HOME%\site\diagnostics\settings.json` JSON file mentioned earlier
        var config = SiteConfigurationProvider.GetAzureLoggingConfiguration(context);
        [...]
        services.AddSingleton<IOptionsChangeTokenSource<LoggerFilterOptions>>(new ConfigurationChangeTokenSource<LoggerFilterOptions>(config));
        [...]
    }
}
So far, we’ve established that a configuration change can trigger an options change notification, which will cause the targetted options value to be recreated.
How options values are built
Now, how does the options factory build up a new value? It uses the several actions that have been registered to configure the value. There are 3 types of actions that can be registered:
IConfigureOptions<T>to configure the default options value;IConfigureNamedOptions<T>to configure an options value with a specific name; andIPostConfigureOptions<T>to ensure a configuration step happens after the previous two we mentioned.
Here’s what the OptionsFactory<T> class implementation looks like, although you can always look at it on GitHub directly:
public OptionsFactory(
    // The configuration actions.
    IEnumerable<IConfigureOptions<TOptions>> setups,

    // The post-configuration actions.
    IEnumerable<IPostConfigureOptions<TOptions>> postConfigures,

    // Out of the scope of this post, but one can register validation steps for an options value as well.
    IEnumerable<IValidateOptions<TOptions>> validations)
{
    _setups = setups;
    _postConfigures = postConfigures;
    _validations = validations;
}

public TOptions Create(string name)
{
    // 1. New up a default instance of our options.
    var options = new TOptions();

    // 2. Run all configuration actions on the created instance.
    foreach (var setup in _setups)
    {
        if (setup is IConfigureNamedOptions<TOptions> namedSetup)
        {
            namedSetup.Configure(name, options);
        }
        else if (name == Options.DefaultName)
        {
            setup.Configure(options);
        }
    }

    // 3. Finally, run all post-configuration steps.
    foreach (var post in _postConfigures)
    {
        post.PostConfigure(name, options);
    }

    // 4. Omitted for brevity is the execution of the validation steps.
    [...]

    // 5. Return the configured options value.
    return options;
}
How the logging system is made aware of options changes
The logging system supports changes to the logging options by internally using an instance of IOptionsMonitor<LoggerFilterOptions> and subscribing to its changes, which when fired will trigger a reevaluation of which filters need to be applied.
Without going into the filter selection logic, this piece of code from the LoggerFactory class reveals how it subscribes to changes:
public LoggerFactory(
    IEnumerable<ILoggerProvider> providers,
    IOptionsMonitor<LoggerFilterOptions> filterOption)
{
    foreach (var provider in providers)
    {
        AddProviderRegistration(provider, dispose: false);
    }

    // 1. Subscribe to options changes, and trigger a refresh of filters when one is triggered.
    _changeTokenRegistration = filterOption.OnChange(RefreshFilters);

    // 2. Set up filters according to the initial value of logging options.
    RefreshFilters(filterOption.CurrentValue);
}

private void RefreshFilters(LoggerFilterOptions filterOptions)
{
    // Implementation omitted.
    // Refreshes filters applied to existing logging providers.
}
Putting it all together
We now have all the pieces to understand how it all works, as we have established the following sequence of events:
- In the Azure portal or through the Azure CLI, we make a change to the logging configuration on our App Service instance;
- The new configuration settings are persisted in a JSON file on the App Service file system;
- The configuration system loads up the new settings from the updated file and triggers a change notification;
- This configuration change is also picked up by the options system through the configuration-to-options adapter, which triggers a rebuild of the
LoggerFilterOptionsvalue; - The options system executes all the registered configuration actions for
LoggerFilterOptions; - One of these configuration actions, as seen earlier, adds a logging filtering rule for the file system logging provider, using the new minimum log level option configured in step 1;
- The options system notifies change subscribers about the new constructed value;
- The logging stack, which is a subscriber of changes to logging options, triggers a refresh of its filters; and finally
- The new filter that targets the App Service file system logging provider ensures only entries with a matching log level get written to disk.
Phew. We made it 🎉! Or did we?
How to customise it
Let’s remember what my mate Stafford was unhappy about: his application log entries were shown in Log stream, but because the log filter didn’t specify a namespace or category, the output was cluttered with entries coming from MVC, making the troubleshooting easier. The good news is that thanks to our understanding of how it all works, we can help Stafford!
The code in this sample is available on GitHub on my mderriey/aspnet-core-logging-provider-for-app-service repository.
The solution I came up with is to add a post-configuration step for logging options, and replace the default filtering rule added by the App Service file system logging provider. The two new rules we’re adding still only apply to this specific logging provider, but have different category and log level properties:
- The first one specifies no category and uses a fixed minimum log level of Error; and
- Another rule that uses the minimum log level defined in the App Service logging configuration, but specifies a category that corresponds to the root namespace of our application.
Only one filtering rule is applied for a single logging provider, and the selection logic will favour one that has a matching category, even if the match is only partial. The result is that loggers created by internal ASP.NET Core code will be applied the first rule, while the ones created for our custom types will trigger the selection of the second one.
// Startup.cs
public void ConfigureServices(IServiceCollection services)
{
    services.PostConfigure<LoggerFilterOptions>(options =>
    {
        var originalRule = options.Rules.FirstOrDefault(x => x.ProviderName == typeof(FileLoggerProvider).FullName);
        if (originalRule != null)
        {
            options.Rules.Remove(originalRule);

            options.AddFilter<FileLoggerProvider>(category: null, level: LogLevel.Error);
            options.AddFilter<FileLoggerProvider>(category: "AspNetCoreLoggingProviderForAppService", level: originalRule.LogLevel.Value);
        }
    });
}
Making sure it works as expected
We can run an MVC app locally to confirm that the solution works.
As discussed earlier, the App Service logging provider is only enabled when the HOME and WEBSITE_SITE_NAME environment variables are set, as they are usually only present when the app runs in App Service.
We can simulate running in that environment by settings these in the lauchSettings.json file.
I’m using IIS Express, so I added them to the appropriate profile, but you can add them to the other if you run the app on Linux or through dotnet run:
{
  "iisSettings": {
    "windowsAuthentication": false,
    "anonymousAuthentication": true,
    "iisExpress": {
      "applicationUrl": "https://localhost:44391",
      "sslPort": 44391
    }
  },
  "profiles": {
    "IIS Express": {
      "commandName": "IISExpress",
      "launchBrowser": true,
      "environmentVariables": {
        "ASPNETCORE_ENVIRONMENT": "Development",
+       "HOME": "<replace-with-the-absolute-path-to-the-home-directory-of-the-git-repository>",
+       "WEBSITE_SITE_NAME": "AspNetCoreLoggingProviderForAppService.Web"
      }
    },
    "AspNetCoreLoggingProviderForAppService.Web": {
      "commandName": "Project",
      "launchBrowser": true,
      "applicationUrl": "https://localhost:44391",
      "environmentVariables": {
        "ASPNETCORE_ENVIRONMENT": "Development"
      }
    }
  }
}
The other configuration that is required is the JSON file from which the logging configuration is loaded from.
We’ve seen that this file is loaded from %HOME%\site\diagnostics\settings.json, so let’s create it in the appropriate location.
The example below enabled logging to the file system, with a minimum log level of Information:
{
    "AzureDriveEnabled": true,
    "AzureDriveTraceLevel": "Information"
}
The final bit before we can run the application is to generate some log entries:
public class HomeController : Controller
{
    private readonly ILogger<HomeController> _logger;

    public HomeController(ILogger<HomeController> logger)
    {
        // Category is the fully-qualified type name of the type we request the ILogger for.
        // In this case, it's AspNetCoreLoggingProviderForAppService.Web.Controllers.HomeController.
        _logger = logger;
    }

    public IActionResult Index()
    {
        EmitLogEntries(nameof(Index));
        return View();
    }

    private void EmitLogEntries(string viewName)
    {
        const string messageTemplate = "Emitting log entry with level {Level} while executing view {View}";

        _logger.LogTrace(messageTemplate, LogLevel.Trace, viewName);
        _logger.LogDebug(messageTemplate, LogLevel.Debug, viewName);
        _logger.LogInformation(messageTemplate, LogLevel.Information, viewName);
        _logger.LogError(messageTemplate, LogLevel.Error, viewName);
        _logger.LogCritical(messageTemplate, LogLevel.Critical, viewName);
    }
}
If we run the app without our post-configuration action on the logging options and hit the home page, we can see that a text file has been created at %HOME%\LogFiles\Application\diagnostics-yyyyMMdd.txt, which certifies our emulation of running in App Service is correctly picked up.
Looking at the content of the file, we can see many entries, and they confirm two things.
First, all entries have a log level of Information or higher, so the AzureDriveTraceLevel property is respected.
We can also notice many entries that originate from framework-level code:
2020-08-09 15:59:09.860 +10:00 [Information] Microsoft.AspNetCore.DataProtection.KeyManagement.XmlKeyManager: User profile is available. Using 'C:\Users\me\AppData\Local\ASP.NET\DataProtection-Keys' as key repository and Windows DPAPI to encrypt keys at rest.
2020-08-09 15:59:09.946 +10:00 [Information] Microsoft.Hosting.Lifetime: Application started. Press Ctrl+C to shut down.
2020-08-09 15:59:09.946 +10:00 [Information] Microsoft.Hosting.Lifetime: Hosting environment: Development
2020-08-09 15:59:09.946 +10:00 [Information] Microsoft.Hosting.Lifetime: Content root path: C:\Users\me\dev\aspnet-core-logging-provider-for-app-service\src\AspNetCoreLoggingProviderForAppService.Web
2020-08-09 15:59:09.955 +10:00 [Information] Microsoft.AspNetCore.Hosting.Diagnostics: Request starting HTTP/2.0 GET https://localhost:44391/
2020-08-09 15:59:09.969 +10:00 [Information] Microsoft.AspNetCore.Routing.EndpointMiddleware: Executing endpoint 'AspNetCoreLoggingProviderForAppService.Web.Controllers.HomeController.Index (AspNetCoreLoggingProviderForAppService.Web)'
2020-08-09 15:59:09.991 +10:00 [Information] Microsoft.AspNetCore.Mvc.Infrastructure.ControllerActionInvoker: Route matched with {action = "Index", controller = "Home"}. Executing controller action with signature Microsoft.AspNetCore.Mvc.IActionResult Index() on controller AspNetCoreLoggingProviderForAppService.Web.Controllers.HomeController (AspNetCoreLoggingProviderForAppService.Web).
2020-08-09 15:59:09.993 +10:00 [Information] AspNetCoreLoggingProviderForAppService.Web.Controllers.HomeController: Emitting log entry with level Information while executing view Index
2020-08-09 15:59:09.997 +10:00 [Error] AspNetCoreLoggingProviderForAppService.Web.Controllers.HomeController: Emitting log entry with level Error while executing view Index
2020-08-09 15:59:09.997 +10:00 [Critical] AspNetCoreLoggingProviderForAppService.Web.Controllers.HomeController: Emitting log entry with level Critical while executing view Index
2020-08-09 15:59:10.010 +10:00 [Information] Microsoft.AspNetCore.Mvc.ViewFeatures.ViewResultExecutor: Executing ViewResult, running view Index.
2020-08-09 15:59:10.066 +10:00 [Information] Microsoft.AspNetCore.Mvc.ViewFeatures.ViewResultExecutor: Executed ViewResult - view Index executed in 60.3482ms.
2020-08-09 15:59:10.067 +10:00 [Information] Microsoft.AspNetCore.Mvc.Infrastructure.ControllerActionInvoker: Executed action AspNetCoreLoggingProviderForAppService.Web.Controllers.HomeController.Index (AspNetCoreLoggingProviderForAppService.Web) in 75.7041ms
2020-08-09 15:59:10.067 +10:00 [Information] Microsoft.AspNetCore.Routing.EndpointMiddleware: Executed endpoint 'AspNetCoreLoggingProviderForAppService.Web.Controllers.HomeController.Index (AspNetCoreLoggingProviderForAppService.Web)'
2020-08-09 15:59:10.069 +10:00 [Information] Microsoft.AspNetCore.Hosting.Diagnostics: Request finished in 114.2617ms 200 text/html; charset=utf-8
Let’s now add back our post-configuration action, and run the app again. Success 🎉! All the framework-level entries have disappeared, because they had a log level lower than Error. However, our custom log entries are still written to the file as expected:
2020-08-09 16:09:26.299 +10:00 [Information] AspNetCoreLoggingProviderForAppService.Web.Controllers.HomeController: Emitting log entry with level Information while executing view Index
2020-08-09 16:09:26.309 +10:00 [Error] AspNetCoreLoggingProviderForAppService.Web.Controllers.HomeController: Emitting log entry with level Error while executing view Index
2020-08-09 16:09:26.309 +10:00 [Critical] AspNetCoreLoggingProviderForAppService.Web.Controllers.HomeController: Emitting log entry with level Critical while executing view Index
Without stopping the app, let’s modify the the %HOME%\site\diagnostics\settings.json file, update the AzureDriveTraceLevel to Verbose, and refresh the page:
2020-08-09 16:11:08.434 +10:00 [Trace] AspNetCoreLoggingProviderForAppService.Web.Controllers.HomeController: Emitting log entry with level Trace while executing view Index
2020-08-09 16:11:08.434 +10:00 [Debug] AspNetCoreLoggingProviderForAppService.Web.Controllers.HomeController: Emitting log entry with level Debug while executing view Index
2020-08-09 16:11:08.434 +10:00 [Information] AspNetCoreLoggingProviderForAppService.Web.Controllers.HomeController: Emitting log entry with level Information while executing view Index
2020-08-09 16:11:08.435 +10:00 [Error] AspNetCoreLoggingProviderForAppService.Web.Controllers.HomeController: Emitting log entry with level Error while executing view Index
2020-08-09 16:11:08.435 +10:00 [Critical] AspNetCoreLoggingProviderForAppService.Web.Controllers.HomeController: Emitting log entry with level Critical while executing view Index
Conclusion
First, thank you for making it all the way down here. This is easily the longest post I’ve written, and I sincerely appreciate you read all of it.
I also want to thank Stafford for reviewing this post before publishing.
In this post, we first discussed what the ASP.NET Core logging provider for App Service is, what it does, and how to enable it in your application. We then analysed its implementation, and discovered it uses built-in capabilities of many foundational parts of ASP.NET Core, such as the configuration and options systems, as well as the primitives used for change notifications. After putting all the pieces together, we came up with a solution to customise which log entries are written to disk and output by App Service Log stream, and found a way to validate that it is working locally.
If you have any questions or comments, please let me know on Twitter!
Cheers 🙇♂️